
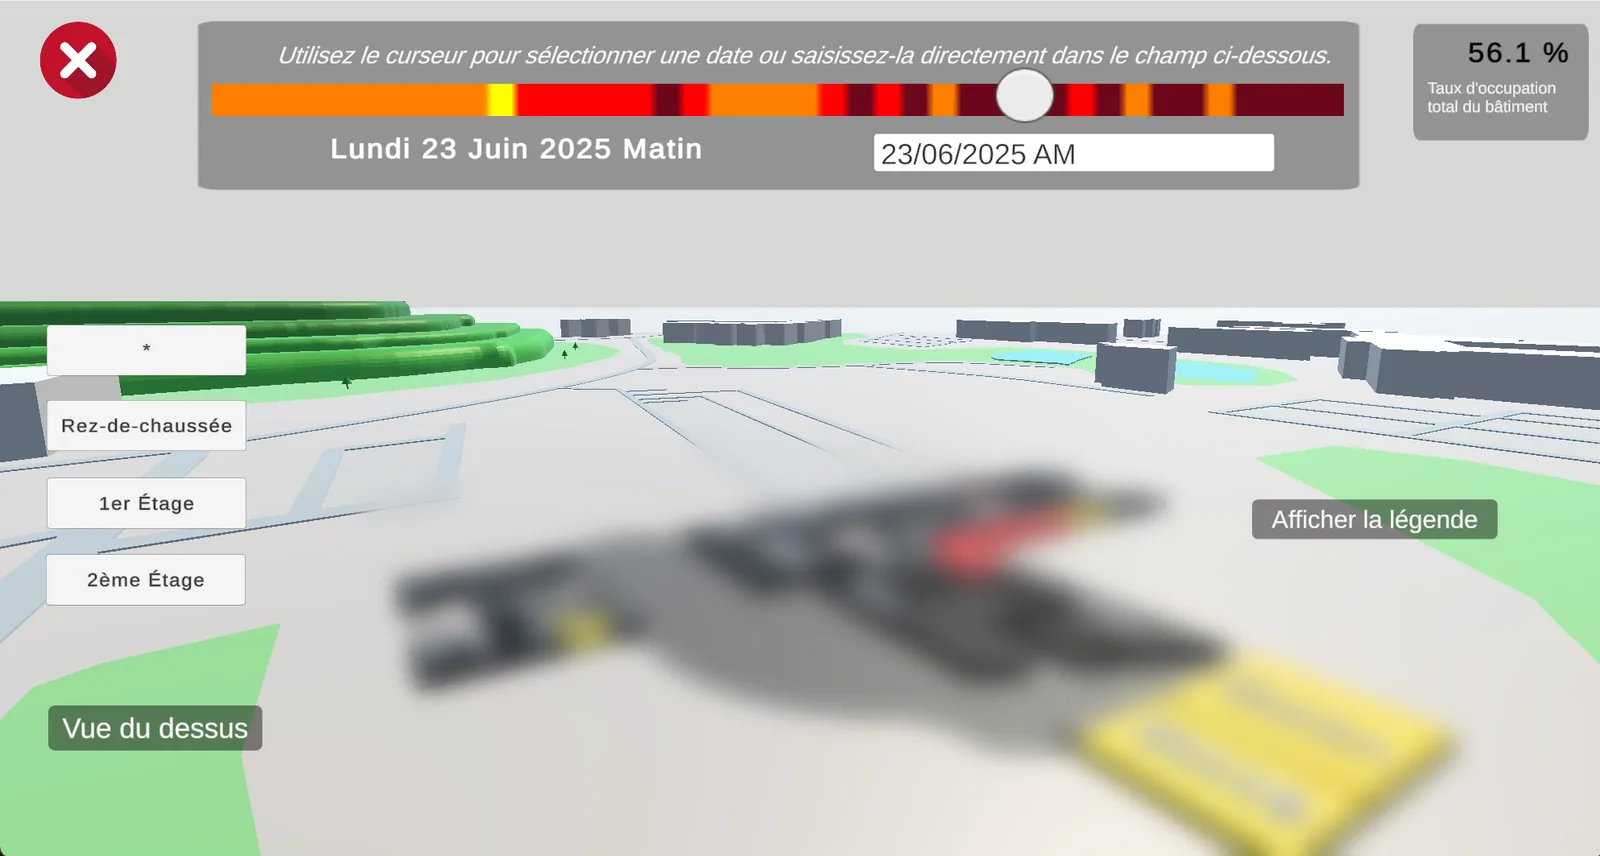
A heat map to reorganise campus rooms
The campus planning unit relied on a booking calendar that showed which rooms were reserved and which ones had been booked twice for the same slot. What it could not tell them was whether a room's capacity was being used well, nor give them an overview of the whole building at a given moment.
The request from the planning department was for a diagnostic tool that would work as a kind of heat map of the building, so they could identify the most and least loaded wings and rearrange room allocation from an overall view of occupancy. The tool had to display the state of each room from an Excel export of the school's management system and give access to the full details of every booking. It had to be built with Unity and shipped as a lightweight executable that would run on most of the department's computers.
Our team was discovering Unity and C# with this project, which led us to organise a shared ramp-up from the very first weeks.
From an ERP export to a coloured room
SmartView follows the path of the data. The Excel export is first converted to CSV, each line describing a booking with its room, time slot, class, lecturer and number of expected students. In the 3D model, each room is an object carrying exactly the name used in that file, so the link between the building and the data needs no lookup table to maintain.
We then compute, for each room and each half-day, an occupancy ratio that divides the number of expected students by the room's capacity. The rooms of the model are generated procedurally, independently of the data, and their styling comes as a second step: each room object receives the ratio of the selected half-day and takes the matching colour, according to thresholds shown in the legend, from green for a well-used room to brown for an overloaded one, with non-bookable rooms darkened so they stay easy to spot. A slider lets the user move through the calendar half-day by half-day, and the rooms change colour as it moves, which reveals at a glance the parts of the building under pressure.
Hovering over a room opens a tooltip with its photo, its name, its occupancy and the full booking details, including the contact of the academic assistant and of the lecturer, taken from the Excel file. This was driven by the intended use: reading a poorly used room should lead straight to an action with the people concerned.
Built incrementally with a timeline added along the way
We built the tool incrementally, starting from a minimal feature and extending it step by step. The first goal was to model shapes in Unity, then to make them change colour from hard-coded data, before reading that data from a CSV file and finally from the Excel export itself. Each step rested on something that already worked, which let the whole team build its skills on a common base.
The model was built from a study of the building's architecture and floor plans. Since renovation work had changed some spaces after those plans were drawn, we visited the rooms and redid that study on site so the model would match the building as it is used today.
We also made the indexes of the columns read in the file configurable from the interface. The export evolves on the business side, and this setting lets the department absorb a format change without waiting for a new version of the software, which was essential for a tool meant to be used on its own. With the same concern for longevity, we studied the option of importing a new building model from within the tool, so it could be fully reused if the building changed. That feature was not a priority and could not be delivered in time, but studying it shaped the structure of the project.
About two thirds into the project, we added a timeline that shows, through colour, the overall occupancy of the building over time. Until then the tool answered the question of each room's state at a chosen moment, while planning also needed to spot the times of day when the whole building was saturated or under-used. This structural change moved SmartView from a room-by-room reading to a reading of the building over time, closer to the heat map the department had asked for.
On the organisational side, we started with Scrum and then moved to a hybrid method better suited to a team of four over three months. We kept weekly cycles and regular check-ins, and I made sure each person had one task tied to their speciality and one cross-cutting task so the whole team progressed in Unity and C#.
From a full 3D model to an exploded floor view
The first version of the model was fully 3D and reused an existing model of the building. It turned out to be hard to read in practice, as load-bearing walls hid part of the rooms and forced the user to move the camera to read a colour. We changed approach for an exploded view, floor by floor and seen from above, which gives an immediate reading of the whole building.
That change also unblocked the tooltip. I had first tried to make it float above the rooms in the 3D model, which ran into camera angle and readability problems. In the exploded view, I was able to build a panel that appears on hover, together with a highlight outline on the room under the cursor.
Delivered and put into real use by the planning team
Version 1.0 was delivered and presented to our internship supervisor, the teaching team, the campus management and the planning unit, which put it to use in real conditions. The tool was well received, and users described the floor-by-floor exploded view as easy to read.
Our roadmap also included a module that would suggest a better allocation of rooms using a greedy algorithm. A team member developed it in Python, but its integration into Unity could not be completed within the time available, as priority went to the final deliverable the department was expecting.